Contents of Article
- Summary
- Why is research important in sports?
- What is statistical significance?
- Why is statistical significance important?
- How is statistical significance calculated?
- Is future research needed on statistical significance?
- Conclusion
- References
- About the Author
Summary
As sport continues to grow and the line between winning and losing becomes progressively thinner, the need for evidence-based research is increasing. Evidence-based research adds to the academic credibility of sport development by challenging knowledge and improving our understanding. However, one issue highlighted is the ability of some practitioners to effectively interpret research findings.
Statistical significance is a scientific method that helps to determine whether reported research findings are actually true. Statistical evidence, therefore, contributes to our level of confidence in research findings, rather than relying on human judgement or bias.
However, simply reporting a significant value does not provide sufficient evidence to make a scientific claim, as it does not tell us the magnitude of the reported difference. Therefore, statistical significance should be used in conjunction with effect size to provide a greater understanding of research findings.

Why is research important in sports?
With increased media exposure and ever-growing fan bases, businesses (e.g. sports teams) in the world of sport are striving to deliver world-class results and performance (1). The resulting pressure on professional athletes to perform well is high, ensuring the need for optimal development from all its practitioners and a competitive edge against the opposition (2,3).
However, optimal performance can only be achieved when adequate knowledge is provided from supporting disciplines (e.g. sports science). Consequently, the demand for evidence-based research is increasing, with the ultimate aim to evaluate the efficacy of sports programmes (4).
This expanding evidence base is adding to the academic credibility of sports development by challenging knowledge and improving our understanding of issues that determine the value and impact of interventions for developing sport (5). By focusing on evidence-based research, practitioners can criticise, with reasonable confidence, the success of a programme in relation to its objectives (6). Ultimately, this can enhance the base for future developments and aid in decision-making regarding the allocation of resources (e.g. time, budget and equipment) (7).
What is statistical significance?
Evidence-based practice is supposed to enhance practical decision-making, but interpreting research is often difficult for some practitioners (8). As such, clinical research is only of value if it is properly interpreted (8).
Underpinning many scientific conclusions is the concept of ‘statistical significance’, which is essentially a measure of whether the research findings are actually true. In other words, statistical significance is the probability that the observed difference between two groups is due to chance or some factor of interest (9, 10). When a finding is significant, it simply means that you can feel confident it is real, not that you just got lucky in choosing the sample.
The most common method of statistical testing is using a specified statistical model to test the null hypothesis (Null Hypothesis Significance Testing; NHST) against a predetermined level of significance (11). This method is essentially generated from four components:
Null Hypothesis
The null hypothesis postulates the absence of an effect (e.g. no relationship between variables, no difference between groups, or no effect of treatment) (9,12). For example, in reality, there is no association between caffeine consumption and reaction times. This is the formal basis for testing statistical significance. By starting with the proposition that there is no association, statistical tests can estimate the probability that an observed variation is due to chance or some factor of interest (13).
Alternative Hypothesis
The alternative hypothesis is the proposition that there is an association between the predictor and outcome variable (13). For example, there is an association between caffeine consumption and reaction times.
Statistical Model
The statistical model is the statistical test chosen to analyse the data and is constructed under a set of assumptions that must be met in order for valid conclusions about the null hypothesis to be made (9). Examples of statistical tests include Independent t-test, ANOVA, and Pearson’s correlation.
Level of Significance
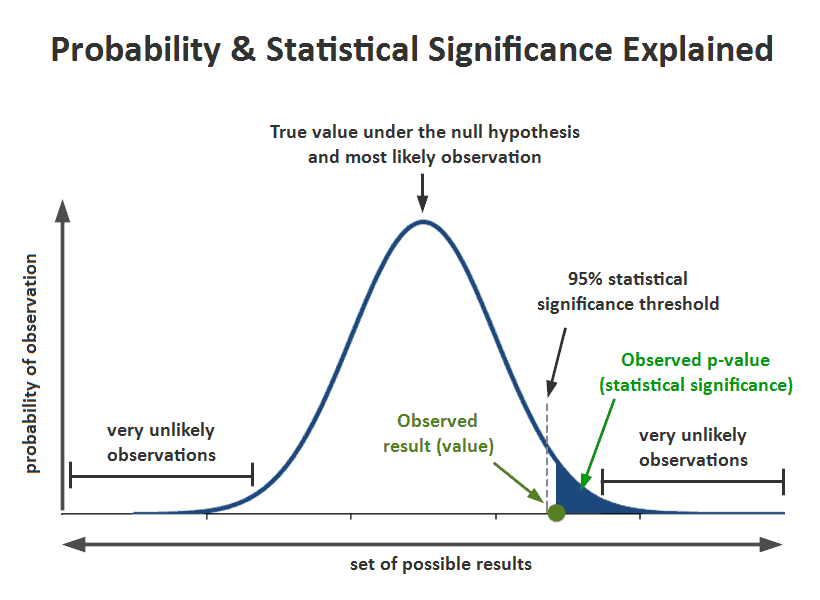
A predetermined level of significance allows for the null hypothesis to either be rejected or accepted (11). The significance level that is widely used in academic research is 0.05, which is often reported as ‘p = 0.05’ or ‘α = 0.05’. The null hypothesis is rejected in favour of the alternative hypothesis if the calculated p-value is less than the predetermined level of significance. For instance, if you were to analyse a set of data looking at reaction times following caffeine consumption, with the resulting significance value being p = 0.03, you are able to reject the null hypothesis and accept the alternative hypothesis, on the basis that all assumptions for the statistical model were met. This is because, the smaller the p-value, the greater the statistical incompatibility of the data with the null hypothesis (14). In other words, the smaller the p-value, the more unusual the data would be if every single assumption were correct (14).
There is a common misconception that lower p-values are associated with having a stronger treatment effect than those with higher p-values (15). For example, an outcome of 0.01 is often interpreted as having a stronger treatment effect than an outcome of 0.05. Whilst this is true if we can be certain that every assumption was met, a smaller p-value does not tell us which assumption, if any, is incorrect. For example, the p-value may be very small because, indeed, the targeted hypothesis is false; however, it may instead be very small because the study protocols were violated (14). As a result, the p-value tells us nothing specifically related to the hypothesis unless we are absolutely positive that every other assumption used for its computation is correct (14) In other words, a lower p-value is not synonymous with importance.
Therefore, we must take caution when accepting or rejecting the null hypothesis and should not be taken as proof that the alternative is indeed valid (12).
Although the use of the p-value as a statistical measure is widespread, the sole use and misinterpretation of statistical significance has led to a large amount of misuse of the statistic and thus has resulted in some scientific journals discouraging the use of p-values (11). For instance, NHST and p-values should not lead us to think that conclusions can be a simple, dichotomous decision (i.e. reject vs not reject) (12). A conclusion does not simply become “true” on one side of the divide and “false” on the other (9). In fact, many contextual factors (i.e. study design, data collection, the validity of assumptions, and research judgement) can all contribute to scientific inference rather than by finding statistical significance (9,12).
Despite these criticisms, the recommendation is not that clinical researchers discard significance testing, but rather that they incorporate additional information that will supplement their findings (11). With that being said, it is important that statistical significance can be correctly interpreted to avoid further misuse.
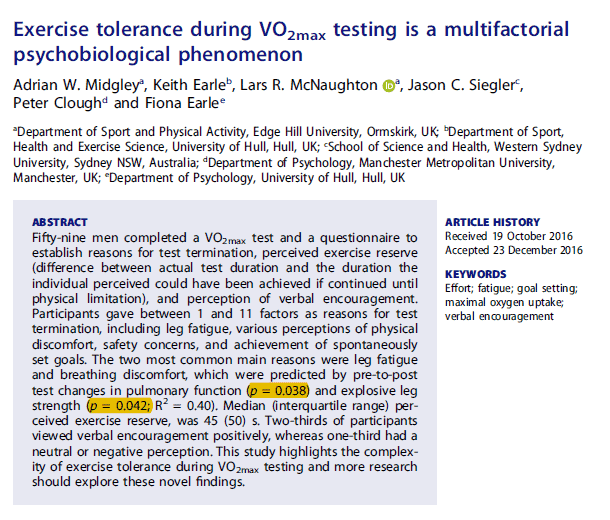
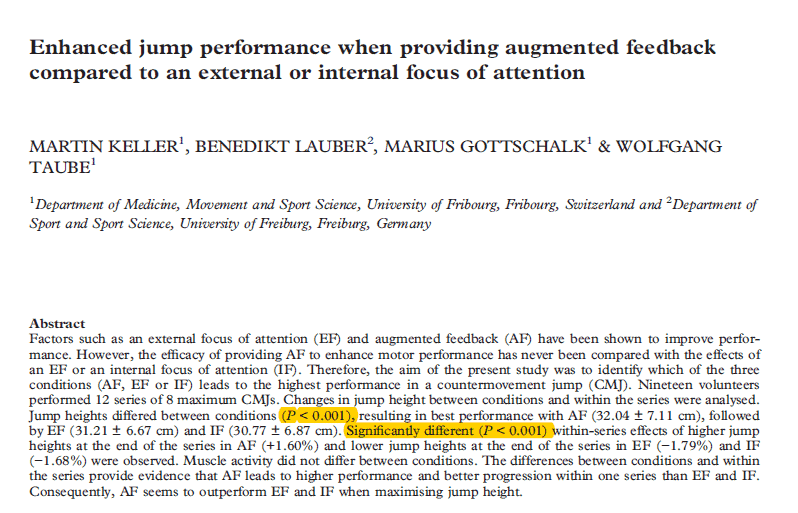
Although 0.05 is used as the cut-off value for significance in the majority of analyses (Figure 1), this figure is not set in stone. In fact, other researchers may reduce the significance level to 0.001 or increase to 0.10 (Figure 2). For instance, if an experiment is difficult to replicate, has access to a large sample size, requires a different standard of rigour or very serious adverse consequences may occur if the wrong decision were made about the hypothesis, then researchers may reduce the significance level to 0.01 in order to be more stringent and reduce the level of chance in the findings (16).
Within research, authors may report varied levels of statistical significance (Figure 3), which is dependent upon the number of variables they have chosen to analyse. Figure 3 also demonstrates the use of an exact p-value (i.e. equals [=]) rather than reporting p < 0.05. Reporting as an exact value gives the reader much greater evidence of the fit of the model to the data. In other words, the lower the p-value, the less compatible the data is to the null hypothesis (i.e. despite both being significant, p = 0.04 is a weaker significance value than p = 0.004 and therefore we would be more confident that the results are ‘true’ with p = 0.004) if we are confident that all assumptions were met. This is because p = 0.04 is closer to the model prediction and all other assumptions, allowing for chance variation (14).
Why is statistical significance important?
Scientific knowledge changes rapidly, but the concepts and methods of conducting research change much more slowly (11) Therefore, currently, significance testing remains the most widely used, convenient and reproducible method for evaluating statistical hypotheses (17), though it’s not without its limitations.
However, degrading practices for their limitations that have been ingrained in the mainstream is easy; the difficulty is providing suitable alternatives that can withstand these criticisms (11). Therefore, it is likely that significance testing will continue to be used for the foreseeable future.
A refined goal of statistical analysis is to provide an evaluation of certainty or uncertainty regarding the size of an effect (14). Statistical significance is therefore used to answer questions on probability – using a scientific method – in order to determine if a hypothesis can be accepted or rejected (8). Scientifically and objectively demonstrating that variables are related, rather than being based on assumptions, gives readers confidence that what they are reading is true (18).
As such, when a report states that the relationship between two variables was found to be statistically significant, there is a normal tendency to feel more inclined toward the research findings (18). For instance, if a study reports that dynamic stretching prior to practice or competition significantly improves power output, we are more likely to implement this method, as there is solid evidence to support the claims. Therefore, statistical evidence contributes to our level of confidence in research findings, rather than relying on human judgement or bias (19).
How is statistical significance calculated?
Calculating statistical significance accurately can be a complicated task if one has little or no understanding of statistics. Fortunately, there are a number of statistical software packages, such as SPSS, JASP, and Stats Engine that can easily determine the statistical significance of experiments that do not require any mathematical equations. Despite this, using significance testing to analyse the results of an experiment is a three-step process (20):
- Formulating a null hypothesis (i.e. formulating a statement to be answered).
- Determining the probability (i.e. setting the significance level to 0.05).
- Accepting or rejecting the null hypothesis (i.e. using statistical significance to determine whether the formulated null hypothesis is true or false).
Statistical significance plays an important role in helping to make sense of statistical data and gives scientific support to claims said to be true. It gives us a level of confidence that an observed change is actually true (18). However, as an isolated value, statistical significance is not sufficient enough to provide a scientific claim (19). This is because statistical significance fails to tell us the magnitude (or importance) of the reported difference (10). A statistic that does tell us the magnitude of the difference is termed the ‘effect size’.
Significance and importance are in actual fact weakly correlated (19), and thus in reporting and interpreting studies, both the substantive significance (effect size) and statistical significance are both essential results to be reported (14). For example, in elite sport, a moderate effect size may not be statistically significant, but it may represent something quite meaningful (e.g. a 10 % drop in a 100m running time could actually translate into reaching close to one’s personal best more consistently) (21).
Is future research needed on statistical significance?
Whilst significance values can provide an important statistic to help interpret research findings, they should not be the sole focus of a statistical report. This is because the arbitrary classification of results into ‘significant’ or ‘non-significant’ is often damaging to the valid interpretation of data (12). Albeit, beyond the scope of this article, there are methods that can be used in conjunction with statistical testing, such as effect size, power analysis and confidence intervals that can supplement findings. For instance, in addition to statistical significance, academics should report the effect size in order to help identify the magnitude of the reported difference (10). In fact, academics should use an estimated effect size prior to their investigation to calculate sample size and to ensure the study is sufficiently powered to help reduce the chance of error (i.e. false negative) (22).
Conclusion
The significance value is an important statistic underpinning many scientific conclusions. Statistical significance uses a scientific method to help determine whether a hypothesis can be accepted or rejected. As such, it gives readers confidence that the reported difference is actually true as it is based on a scientific concept, rather than human judgement.
However, despite its ability to interpret differences in statistical data, it fails to tell us the magnitude of this difference. Therefore, both effect size and statistical significance are both essential results to be reported and/or interpreted in research.
- Dohmen, T. J. (2008). Do professionals choke under pressure? Journal of Economic Behavior & Organization, 65(3-4), 636–653. https://econpapers.repec.org/article/eeejeborg/v_3a65_3ay_3a2008_3ai_3a3-4_3ap_3a636-653.htm
- Freitas, S., Dias, C., & Fonseca, A. (2013). Psychological skills training applied to soccer: A systematic review based on research methodologies. Review of European Studies, 5(5), 18-29. http://dx.doi.org/10.5539/res.v5n5p18
- Reade, I., Rodgers, W., & Hall, N. (2008). Knowledge transfer: How do high performance coaches access the knowledge of sport scientists? International Journal of Sports Science and Coaching, 3(3), 319–334. http://dx.doi.org/10.1260/174795408786238470
- Hills, L. and Maitland, A. (2014). Research-based knowledge utilization in a community sport evaluation: a case study. International Journal of Public Sector Management, 27(2), 165-172. http://dx.doi.org/10.1108/ijpsm-04-2013-0051
- Grix, J. and Carmichael, F. (2012). Why do governments invest in elite sport? A polemic. International Journal of Sport Policy and Politics, 4(1), 73-90. http://dx.doi.org/10.1080/19406940.2011.627358
- Rossi, P. H., Lipsey, M. W. and Freeman, H. E. (2004). Evaluation: a systematic approach. 7th ed., London: Sage Publications. https://www.amazon.com/Evaluation-Systematic-Approach-Peter-Rossi/dp/0761908943
- Daniels, J. (2015). Evidence based practice in sport development: A Realistic Evaluation of a sport and physical activity strategy. Doctoral thesis (PhD), 1-294. https://e-space.mmu.ac.uk/608775/
- Page, P. (2014). Beyond Statistical Significance: Clinical Interpretation of Rehabilitation Research Literature. International Journal of Sports Physical Therapy, 9(5), 726-736. https://www.ncbi.nlm.nih.gov/pmc/articles/PMC4197528/
- Wasserstein, R. and Lazar, N. (2016). The ASA’s Statement on p-Values: Context, Process, and Purpose. The American Statistician, 70(2), 129-133. http://amstat.tandfonline.com/doi/abs/10.1080/00031305.2016.1154108#.WeC6jGhSyUk
- Sullivan, G. and Feinn, R. (2012). Using Effect Size – or Why the P Value Is Not Enough. Journal of Graduate Medical Education, 4(3), 279-282. http://dx.doi.org/10.4300/jgme-d-12-00156.1
- Glaser, D. (1999). The controversy of significance testing: misconceptions and alternatives. American Journal of Critical Care, 8(5), https://www.ncbi.nlm.nih.gov/pubmed/10467465
- Verdam, MG., Oort, FJ. and Sprangers MA. (2014). Significance, truth and proof of p values: reminders about common misconceptions regarding null hypothesis significance testing. Qual Life Res, 23(1), 5-7. https://www.researchgate.net/publication/236933923_Significance_truth_and_proof_of_p_values_Reminders_about_common_misconceptions_regarding_null_hypothesis_significance_testing
- Banerjee, A, et al. (2009) Hypothesis testing, type I and type II errors. Industrial Psychiatry Journal, 18(2), 127-131. https://www.ncbi.nlm.nih.gov/pmc/articles/PMC2996198/
- Greenland, S. et al. (2016). Statistical tests, P values, confidence intervals, and power: a guide to misinterpretations. European Journal of Epidemiology, 31, 337-350. https://link.springer.com/article/10.1007/s10654-016-0149-3
- Gliner, J., Leech N. and Morgan G. (2002). Problems with Null Hypothesis Significance Testing (NHST): What Do the Textbooks Say? The Journal of Experimental Education 7(1), 83-92. https://www.tandfonline.com/doi/abs/10.1080/00220970209602058
- Cramer, D., & Howitt, D. (2006). The Sage dictionary of statistics. London: SAGE. https://www.emeraldinsight.com/doi/abs/10.1108/09504120510580208
- Sham, PC. and Purcell SM. (2014). Statistical power and significance in large-scale genetic studies. Nature Reviews Genetics, 15(5), 335-346. https://www.nature.com/articles/nrg3706
- Weinbach, R. (1984). When Is Statistical Significance Meaningful? A Practice Perspective. Journal of Sociology & Social Welfare, 16(4), 31-37. http://scholarworks.wmich.edu/cgi/viewcontent.cgi?article=1880&context=jssw
- S. (2016). Statistical significance and scientific misconduct: improving the style of the published research paper. Review of Social Economy, 74, 83-97. http://www.tandfonline.com/doi/abs/10.1080/00346764.2016.1150730?journalCode=rrse20
- Greco, D. (2011). Significance Testing in Theory and Practice. The British Journal for the Philosophy of Science, 62(3), 607-637. https://academic.oup.com/bjps/article/62/3/607/1509462/Significance-Testing-in-Theory-and-Practice
- Andersen, M., McCullagh, P., & Wilson, G. (2007). But What Do the Numbers Really Tell Us? Arbitrary Metrics and Effect Size Reporting in Sport Psychology Research. Journal of Sport and Exercise Psychology, 29(5), 664-672. http://dx.doi.org/10.1123/jsep.29.5.664
- Sainani, K. (2009). Putting P values into perspective. PM & R: The Journal of Injury, Function, and Rehabilitation, 1(9), 873-877. http://dx.doi.org/10.1016/j.pmrj.2009.07.003


